 E-Code
How to find mean and standard deviation on a TI-84 Plus CE or TI-84 Plus
Press STAT, ENTER for Edit and type your numbers into L1, then 2nd QUIT. Press STAT, ▶ to CALC, ENTER for 1-Var Stats, ▼ twice to Calculate and ENTER: x̄ is the mean and Sx the standard deviation.
Step by step
- Open STAT. STAT Press STAT.
- Open the list editor. ENTER Press ENTER for Edit. The columns L1, L2… are lists that hold data.
- Type your data. 4 ENTER 8 ENTER 6 ENTER 5 ENTER 7 ENTER Type each number and press ENTER after it: 4, 8, 6, 5, 7. They go into L1.
- Go back home. 2nd MODE Press 2nd, then MODE. QUIT (above MODE) takes you back to the home screen. Your list is kept.
- Back to STAT. STAT Press STAT again.
- The CALC tab. ▶ Press ▶ to move to CALC, the calculations.
- Pick 1-Var Stats. ENTER Press ENTER for 1-Var Stats. It asks which list: L1 is already filled in.
- Go down to Calculate. ▼ ▼ Press ▼ twice to reach Calculate.
- Calculate. ENTER Press ENTER.
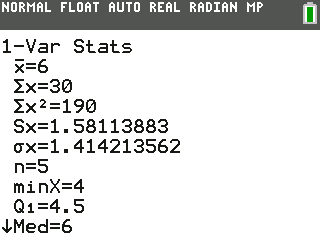
- Every summary at once. x̄ = 6 is the mean and Sx = 1.58 the sample standard deviation. Press ▼ to scroll down to Med, the median.
What the screen shows
x̄ = 6 is the mean and Sx = 1.58 the sample standard deviation. Press ▼ to scroll down to Med, the median.
Look for =6 on the screen.
Try it with the keys lit up
This guide is one of E-Code's Learn lessons. Open it on E-Code's TI-84 calculator and each key lights up in turn as you press it.
Try “Find mean and standard deviation” on the TI-84 calculator
Related
- Find mean and standard deviation (TI-83 Plus)
- Show r and r² on a regression (TI-84 Plus CE)
- Show r and r² on a regression (TI-84 Plus)
- Show r and r² on a regression (TI-83 Plus)
- Graph a line of best fit
Statistics programs for the TI-84 Plus CE:
- Regression: linear, quadratic, exponential with r²
- Hypothesis tests: z, t, two-sample t, chi-square
- Confidence intervals: z, t, proportion, two-sample
All TI-84 statistics guides · All TI-84 guides · All calculator guides